Home Assistant utility meter setup
In our house we have a few older generation Teckin SP22’s running Espurna and newer Gosund SP111 running Tasmota that all publish their energy statistics via MQTT to Home Assistant.
I wanted a unified way to visualise the daily and monthly energy usage of these devices to better grasp how much energy we are consuming.
Home Assistant provides a Utility Meter component that allows exactly that behaviour, with the granularity of even providing peak and off-peak tariffs if your energy provider offer such.
The problem however is this operates on a single entity and the devices that I had configured are exposed individually.
e.g. this is how Espurna and Tasmota expose them when manually configured.
# Tasmota

- name: socket_7_energy
  platform: mqtt
  state_topic: "tele/socket-7/SENSOR"
  value_template: ''
  unit_of_measurement: kWh
- name: socket_7_power
  platform: mqtt
  state_topic: "tele/socket-7/SENSOR"
  value_template: ''
  unit_of_measurement: W

# Espurna

- name: socket_balcony_energy
  platform: mqtt
  state_topic: socket-6/energy
  unit_of_measurement: kWh
- name: socket_balcony_power
  platform: mqtt
  state_topic: socket-6/power
  unit_of_measurement: W
To unify these sensor readings you can use the powerful Templating platform to combine these and expose them as a single reading.
- platform: template
  sensors:
    energy_total_usage:
      friendly_name: Total Energy Usage
      unit_of_measurement: kWh
      value_template: >-
        {{
          (states.sensor.socket_media_energy.state | float) +
          (states.sensor.socket_desk_energy.state | float) +
          (states.sensor.socket_coffee_energy.state | float) +
          (states.sensor.socket_aurora_bedlight_energy.state | float) +
          (states.sensor.socket_fairy_lights_energy.state | float) +
          (states.sensor.socket_7_energy.state | float) +
          (states.sensor.socket_8_energy.state | float)
        }}
    power_total_usage:
      friendly_name: Total Power Usage
      unit_of_measurement: W
      value_template: >-
        {{
          (states.sensor.socket_media_power.state | float) +
          (states.sensor.socket_desk_power.state | float) +
          (states.sensor.socket_coffee_power.state | float) +
          (states.sensor.socket_aurora_bedlight_power.state | float) +
          (states.sensor.socket_fairy_lights_power.state | float) +
          (states.sensor.socket_7_power.state | float) +
          (states.sensor.socket_8_power.state | float)
        }}
Next you’ll be able to hook up the utility meter configuration as such.
energy_total_usage_daily:
  source: sensor.energy_total_usage
  cycle: daily

energy_total_usage_monthly:
  source: sensor.energy_total_usage
  cycle: monthly
Visualising
Like in previous posts, I highly recommend the Mini Graph Card extension by @kalkih. It provides various minimalistic and customisable cards that can be useful for displaying metrics and sensor statistics.
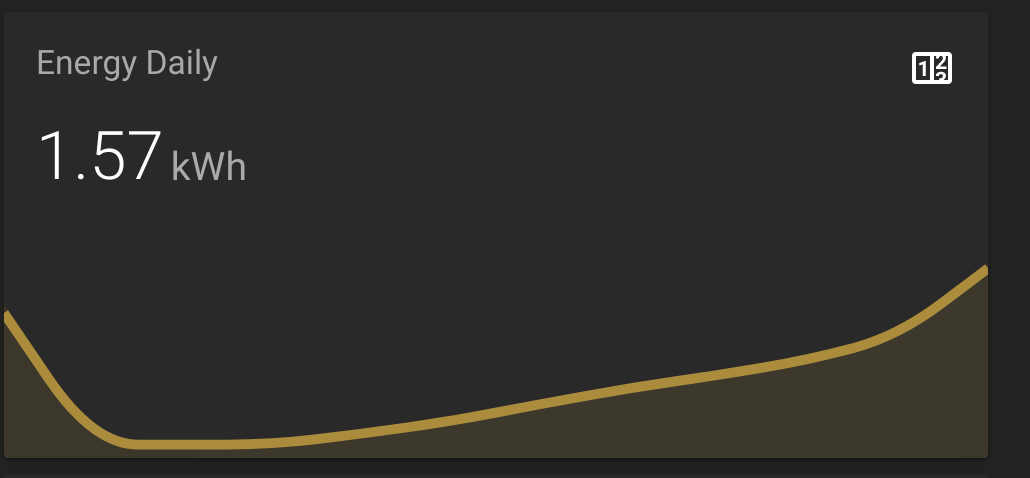
  - type: custom:mini-graph-card
    name: Energy Daily
    entities:
      - sensor.energy_total_usage_daily
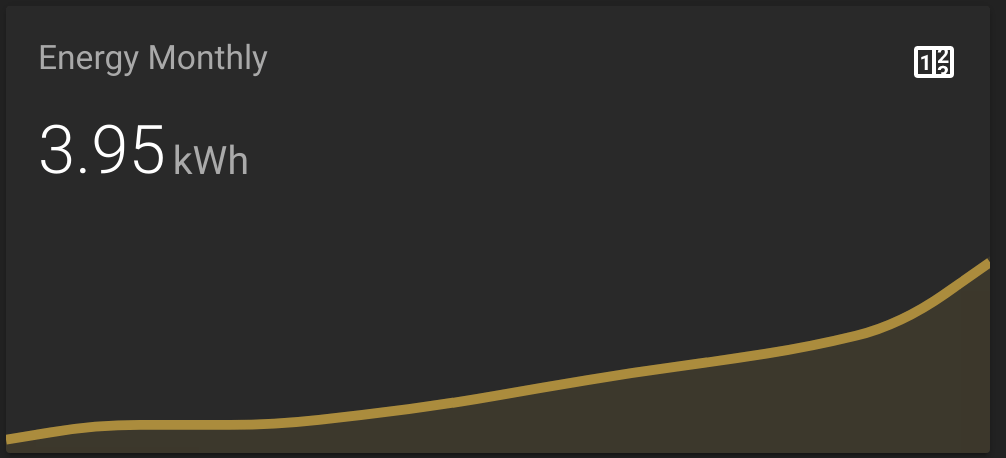
  - type: custom:mini-graph-card
    name: Energy Monthly
    entities:
      - sensor.energy_total_usage_monthly

  - type: gauge
    name: Power
    unit: W
    max: 1500
    entity: sensor.power_total_usage
    severity:
      green: 100
      yellow: 150
      red: 300
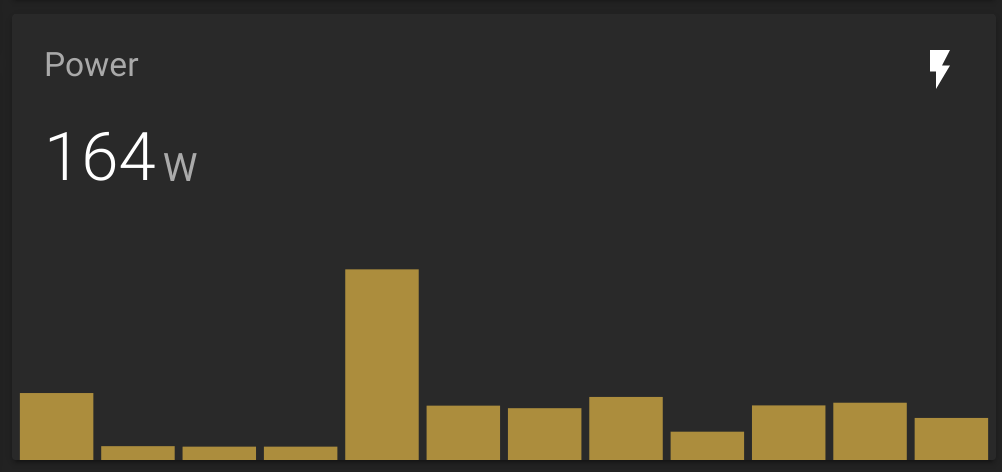
  - type: custom:mini-graph-card
    name: Power
    icon: mdi:flash
    entities:
      - sensor.power_total_usage
    show:
      graph: bar
Next steps
While this easily gives you nice daily and monthly unified overviews the power consumption of your smart plugs it doesn’t allow you to query other time frames or drill down by device, without exposing the stats for each sensor manually.
An alternative approach which would complement this setup would be to publish your sensor stats to InfluxDB and graph this data using Grafana. But that’ll be for another post.